Forex trading, a dynamic and often unpredictable market, demands a keen understanding of technical analysis tools. Among these tools, trend lines stand out as a simple yet powerful method for identifying potential trading opportunities. By accurately drawing and interpreting trend lines, traders can gain valuable insights into market direction, potential support and resistance levels, and overall market momentum. This knowledge allows for more informed decisions, ultimately increasing the likelihood of profitable trades.
Understanding the Basics of Forex Trend Lines
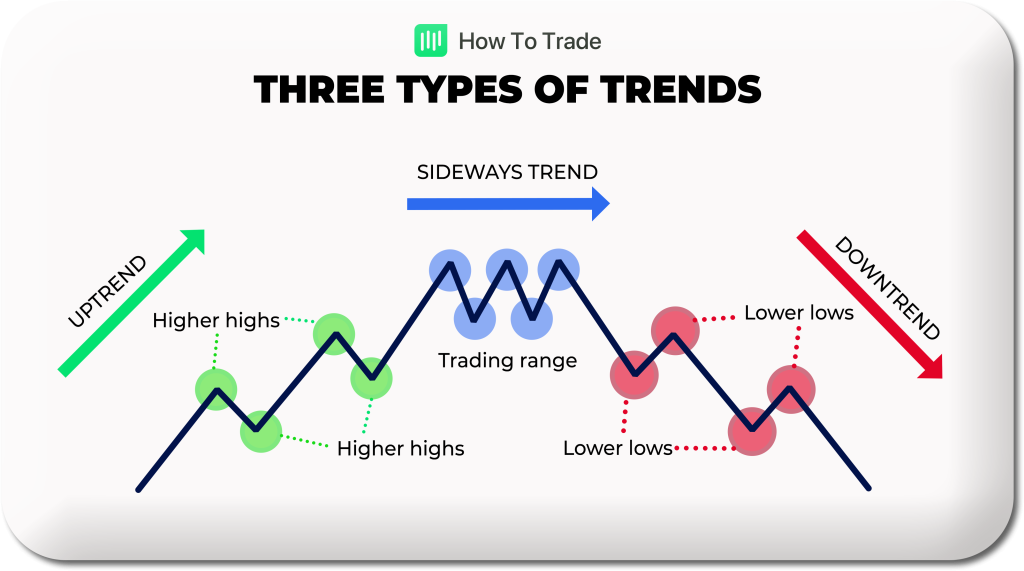
A trend line is a straight line drawn on a price chart that connects a series of highs or lows, indicating the direction of the market. Trend lines help traders visualize the prevailing trend and identify potential areas of support or resistance.
- Uptrend Line: Drawn below a series of higher lows. It acts as a potential support level.
- Downtrend Line: Drawn above a series of lower highs. It acts as a potential resistance level.
Drawing Accurate Trend Lines
Drawing trend lines correctly is crucial for their effectiveness. Here are some key considerations:
- Minimum Two Points: A trend line requires at least two points (highs or lows) to be drawn. However, a trend line is only validated when it’s touched by price a third time.
- Angle of the Trend Line: Steeper trend lines are generally less reliable and more prone to breaks. A moderate angle is usually preferred.
- Timeframe: Trend lines can be drawn on any timeframe, from short-term (e.g., 1-minute chart) to long-term (e.g., daily or weekly chart). Longer timeframes tend to produce more reliable trend lines.
Using Trend Lines to Identify Trading Opportunities
Trend lines can be used in various ways to identify potential entry and exit points.
| Strategy | Description | Example |
|---|---|---|
| Trend Line Bounce | Enter a trade when the price bounces off a trend line acting as support or resistance. | Buy when price bounces off an uptrend line; Sell when price bounces off a downtrend line. |
| Trend Line Breakout | Enter a trade when the price breaks through a trend line, indicating a potential change in trend. | Buy after a downtrend line is broken upwards; Sell after an uptrend line is broken downwards. |
| Trend Line Retest | After a breakout, wait for the price to retest the broken trend line (now acting as the opposite – support becomes resistance, resistance becomes support) before entering a trade. | After a downtrend line breaks upwards, wait for price to pull back and test the line as support before buying. |
Managing Risk with Forex Trend Lines
Trend lines are also valuable for managing risk. Traders can use trend lines to set stop-loss orders and take-profit levels.
- Stop-Loss Orders: Place stop-loss orders slightly below an uptrend line (for long positions) or slightly above a downtrend line (for short positions).
- Take-Profit Levels: Identify potential take-profit levels based on the projected continuation of the trend. Consider using Fibonacci extensions or other technical indicators in conjunction with trend lines.
FAQ: Trend Lines in Forex - Q: How reliable are trend lines?
- A: While trend lines are a useful tool, they are not foolproof. Market conditions can change rapidly, and trend lines can be broken. It’s essential to use trend lines in conjunction with other technical indicators and fundamental analysis.
- Q: What timeframe is best for drawing trend lines?
- A: The best timeframe depends on your trading style. Short-term traders may use shorter timeframes (e.g., 5-minute or 15-minute charts), while long-term traders may use longer timeframes (e.g., daily or weekly charts). Longer timeframes generally provide more reliable signals.
- Q: How many touches are needed to confirm a trend line?
- A: While a trend line can be drawn with just two points, it is generally considered confirmed after it has been touched by price a third time. The more times a trend line is touched, the stronger it is considered.
Trend lines are a fundamental tool for any forex trader seeking to understand market direction and identify potential trading opportunities. By mastering the art of drawing and interpreting trend lines, traders can gain a significant edge in the market. However, it’s crucial to remember that trend lines are not a standalone solution. They should be used in conjunction with other technical indicators, fundamental analysis, and sound risk management strategies. Consistent practice and a disciplined approach are key to effectively utilizing trend lines and improving your overall trading performance. Ultimately, understanding and skillfully applying trend lines will contribute to more informed and potentially profitable trading decisions.